The important role of uncertainty around expected lifetime in making plans for retirement consumption has been around for a while and has seemed, based on my n=1 read of the literature, to be something found more often in economics papers than in finance though I think that is changing. The pivotal role of this complicator became most manifest in Yaari (Uncertain Lifetime, Life Insurance and the Theory of the Consumer, 1965) which focused on optimal consumption and annuitization given random life among other things.
"Wealth / Life Expectancy" as it Relates to Consumption Choice
Subsequent papers over the years (e.g., Merton 1969, Samuelson 1969, Milevsky & Huang 2010, Irlam & Tomlinson 2014 among others) have made various heuristic conclusions that, due to the role of longevity uncertainty, a proxy for optimal consumption can sometimes devolve to "wealth divided by a measure of remaining life expectancy."
"Their [Merton and Samuelson] work also addressed consumption over the life cycle, and they were able to show that, under one particular set of reasonable assumptions[note 1 ... pay attention to the particularity], optimal spending each year could be approximately determined as current wealth divided by remaining life expectancy. Milevsky and Huang [2010] later demonstrated a similar result." [Irlam and Tomlinson, italics added]
This is a convenient heuristic (with the proviso in [1] and [2] and the discussion in Irlam 20xx) and I should note that the principles underlie the IRS RMD calculation tables as well. I have used this method often myself to keep whatever I was working on simple and moving along quickly. I also once fwiw created, for fun, a rule of thumb for spending that also factors in a very conservative age related calculation that always seemed to work pretty well for me (it was a bit tongue in cheek at the time). My guess is that factoring in age and life expectancy is always going to dominate not doing so for "good in-the-moment consumption choice" but I don't even come close to proving that here. I am just taking a look at the W/e proxy today and how it might work. This does, by the way, replicate some past work here.
In using W/e, where "e" is some measure of remaining life -- and here I am assuming "remaining life is conditional on reaching some particular age in the first place" i.e., not measuring from birth -- the challenge I often ran into was asking myself "what expectancy" (of the many) or "what simplifying statistic" (of the many) should be used. Average life expectancy based on some table is fair, yes, and using the mean is fair, yes, but there are many tables and the longevity distribution (PDF) is not a normal distribution (more reciprocal gamma according to Milevsky) which means that the mean might misrepresent in minute ways if we are not careful.[2]
A Word on a Couple Actuarial Tables
For actuarial tables I feel sometimes like there are an infinity of choices and certainly actuaries have created a ton for various purposes. But one common table used is the Social Security life table. This, generally speaking, represents an average life, neither too compromised in health (i.e., not so conservative) nor is it too conservative: average. For conservative or for insurance companies selling annuities -- there is some self-selection in that cohort -- it pays to use something more like the Society of Actuaries Individual Annuitant Mortality tables of which there are several and the application of which I often seem to get wrong. I have been corrected a few times (I be but a simple blogger). SOA IAM is tuned to a population that lives longer (at the mode anyway) and allows more profitable underwriting.
I have no problem with these and I have used both in a number of simulations in the past. For simple "retail" access to the tables I'd recommend Gordon Irlam's aacalc.com site where for a given age results from the tables at various percentiles and the mean are presented.
With respect to using tables, I only had a couple minor problems for my past work building some code. For example:
- The tables are hard to work with sometimes but that might just be me. It is a little unwieldy for simple quick coding efforts, though,
- The tables get out of date over time and one needs to learn the actuarial adjustments. This is a bit of a hassle for my purposes and the last time I tried I got totally turned around and almost gave up,
- The tables are based on real actuarial work on real past populations of people and are tuned to particular underwriting or policy tasks. That's fine as far as it goes but for "wide open thinking" they, the tables, under-imagine other possible future or alternative worlds which is the bread and butter of simulation modeling...in my opinion,
- I never know which table to use if I do use a table. Generally speaking I opt for "more conservative" so I often use the SOA IAM tables or proxies. But again, even that is not extreme enough for some things I want to test,
- The table adjustments for evolving longevity experience don't allow me to explore phase-shifts in what might happen in the future. The mean/mode of the distribution changes a little bit over time, sure, but terminal age irl generally does not ... BUT... what if I want to turn the dial way up on both of those?,
- The tables are discrete not continuous. This has never been a problem for me but continuous proxies are quite convenient to use in code.
A Word on Survival Probabilities
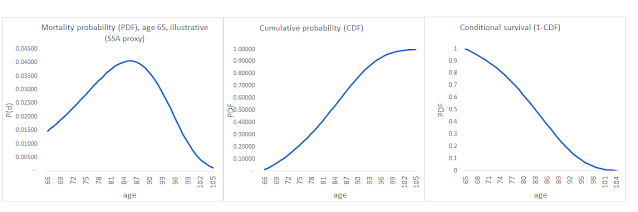
For blog-post-reference, here is a simple, rough illustration of the mortality probability for a 65yo male using a proxy for the SSA life table. I hope I got this right. The left box is the probability of dying for a 65yo in future years from that age. Not an actuary so if I mis-describe any of this you can message me or comment. The middle is the cumulative probability (CDF). This integrates the left box and gives me my percentiles when I need them. The right is 1-CDF which is also a conditional (on age attained) survival probability and is of great use in weighting/discounting future events in retirement finance. Also the sum of the right box, using an actuarial hack, yields the mean longevity expectation in years, conditional on the age, which is also of use to me. This post tends to focus on the right box formulation.
 |
| Figure 1 |
Comparing the Actuarial Tables and Some Fake Hypotheticals
So, using the right box conditional survival formulation, here is an example I used in the past (Selden, 2019) with the two tables plus a couple other hypotheticals that exist on no table of which I know. This (figure 2) is just to see the differences for now. Note that this was done for age 60 not 65 and the x axis is in years from 60 rather than age.
 |
| Figure 2 |
Y axis is conditional survival probability, x axis is year from age 60. The blue and orange lines (A and B in this figure) are derived from the SSA and SOA tables. Lines C (extreme low longevity) and D (extreme high longevity) are the hypotheticals generated using some continuous Gompertz math I lifted from one of Milevsky's books. It looks like this:
 |
| Eq 1 |
where t is the x axis in figure 2, m is the central tendency or mode, b is some measure of dispersion, x is the start age or 60 here, and e is the constant "e." If I were to rough-fit this Eq 1 to the SOA and SSA tables, then all four lines -- A B C D -- would parameterize roughly like this though I don't know if this is exact. Note that C and D are 100% arbitrary and entirely imaginary. I have seen other parameterizations in other papers:
 |
Figure 3 |
Back to "Wealth / Expectancy" as it Relates to a "Consumption Zone"
In past posts I have asserted with limited conviction that there are no real optimal solutions in retirement finance. First, the second one calculates something optimally, the world will change on a dime and sometimes bite you. Second, if one were to believe in the idea of using multiple models to find one's intuition -- I call this "triangulation" and I do believe in this -- then single point answers become less meaningful and clouds or zones of answers take on more utility.
In this post I am going to take Figure 1 and its lines C and D and do the W/e calculation at ages 60 - 85 (actually to 95 but not shown) in 5 year increments to infer longevity-heuristic consumption estimates at what in figure 1 might be called the boundaries (C &D). Except C&D are based on the mean "e" and so I add to my figure 4 a consumption estimate for line D again but now using the 90th percentile expectation rather than the mean. Not exactly a real "boundary" yet but we are closer. I ignore extending line C because I am more interested in risk and D is where the risk lives. I throw in a 4% spend cuz why not. My thinking in figure 4 is that longevity estimation is bogus at non-population levels (i.e., at my level) and that the "boundaries" are just soft versions of "go not too far above here and not too far below there and in the middle is plausible but lower is more conservative." All this is in the absence of annuities or pensions or SS by the way. That is another story. Nor have we discussed random returns yet. They are somehow implicit I think but I haven't teased that out [Note 1 has a partial answer].
So, assuming conditionally calculated survival, sick and super healthy "boundaries," mean and 90th percentile longevity, Gompertz math, no pension, and a (Merton-esque) proxy calc of 1/e for sorta optimal spending we get something that looks like this in Figure 4 where Black is derived from line C in figure 4, Red is derived from line D and the red-thin line is based on a 90th percentile longevity embedded in D rather than the mean.
 |
| Figure 4 |
Discussion
I mean, what exactly can I take from all this? Basically: maybe if you have a bad health diagnosis at 65 it looks like you can burn a little money that is not needed for the doctor or your legatees (a tease, that is not financial advice). If you think like an annuitant and believe you'll live a good long while at 65 it looks more like a 4% (.039) spend which confirms at least some of the intuition on the 4% rule at 65. In addition, if one has super high risk aversion -- yeah, we have not even touched on that topic yet -- and think that one might have a weirdly long life then at age 65, the spend "boundary" (and I am still using that word loosely) here in this post is closer to 3% (.029) . That latter has been my target for a while in an early retirement starting at 50 where life is, in fact, expected to be pretty long. In other words, a highly risk averse 65 year old is more or less like an average 50 year old in consumption-risk choice terms.
Me? I will be updating my conservatizing assumptions when I turn 65 or enter SS. TBD.
Appendix 1 - Playing with My Old Rule of Thumb
Given this set-up, I wanted to see where my old RH40 spend rule fits in the output. RH40 was this
S = Age / (40 - age/3) + n
where "n" is a little +/- for risk or bravado. I cooked this up based on a piece by Evan Inglis where he said a simple rule for spend at 65 is divide by 20. He added that at 90 maybe it's more like 10. So I just cooked up a more continuous version that is awkward but it works and we can see that it is not entirely detached from the discussion above. In past testing it comes very close to solving the kolmogorov LPR equation for spending at constant 5% probability of life ruin at each age. It also compared well to the Merton solution at very long life expectancies which will look more obvious below.
So with ages 60 - 85 in 5 year intervals and n = to an arbitrary .005 if we add RH40 to figure 4 it looks like this with the blue line being new here:

RH40 does a good job of tracking a long lived expectation in some way. But one has to ask: why RH40. Okay, no one in self-planning is going to use this. It'd be easier to go to aacalc.com and get a 90th percentile SOA expectancy. Easy. Otoh it is easy to code, tests well against optimal or optimal-ish solutions, and were I in a bar with no internet and someone wanted to know what a 75 yo could conservatively spend absent a pension, I have a guess. How many times will that happen? Likely zero.
Notes
----------------------------------------------------
[1] Irlam (20xx) puts it like this: "I can get away with this because the discount rate is small. If nu is small enough, and life expectancy is fixed, the optimal consumption is W / e. In reality we should consume more because the portfolio experiences growth over time (ignoring withdrawals), but we should consume less to set aside funds for the possibility that we live longer than our life expectancy. On balance it is thought these two largely cancel out and the simple rule, W / e, seems to work quite well."[2] As in note 1, we have to be careful to say we are working with a fixed life expectancy when we use W/e whether we use mean "e" or 90th %ile or whatever. This is not a stochastic exercise even tho we are extracting longevity estimates from distributions, table or fake or whatever.
References
-----------------------------------------------------
Irlam, G and Tomlinson J. "Retirement Income Research: What can we Learn From Economics?" Journal of Retirement, Spring 2014
Irlam "Simple Rules of Thumb for Investing," (20xx) https://www.aacalc.com/docs/simple_rules
Merton, R.C. “Lifetime Portfolio Selection Under Uncertainty: The Continuous Time Case.” Review of Economics and Statistics (1969), pp. 247-257
Milevsky, M.A., and H. Huang. “Spending Retirement on Planet Vulcan.” Financial Analysts Journal (2010), pp. 45-58.
Samuelson, P.A. “Lifetime Portfolio Selection by Dynamic Stochastic Programming.” The Review of Economics and Statistics (1969), pp. 239-246.
Selden,W. Overthinking Social Security Claim Age, 2019 https://rivershedge.blogspot.com/2019/04/overthinking-social-security-claim-age.html
Does this mean that if W is consistently growing (in nominal or real terms?) then I must be under-spending?
ReplyDeleteMaybe, idk. This was weirdo off-road analysis. The note 1 from Irlam seems to say return assumptions somehow offset conservative underspending and I gather that makes W/e work in some narrow sense. This was not my greatest effort even though it might be the last... I keep saying that tho. To be not-glib: being conservative about return assumptions -- or circumspect about equity prem in general -- would mean leaning towards a lower spend while if one were to be a little more sanguine, then spending more is probably ok as long as there is a planB in case it doesn't play out. My kids have been put on notice for PlanB btw
ReplyDelete