My friend David C says I sandbag on this blog way too much. Otoh, it is sometimes warranted. So, here is the real-deal as I wind down my blog:
- I do not have a background in statistics or probability
- I do not have a background in math or econ
- I do have a BA in Religion! OMG! (get the joke?)
- I do have an MBA in finance from '88 but I consider that almost worthless. What did I learn? Some NPV analysis and a few marketing mantras? Heh. What the hell did I spend on that degree anyway?
- I did do a self-study in calc/diff-eq, retirement finance, stats, probability, linear algebra, coding and data science, macro econ, continuous time finance, financial modeling, decisions under uncertainty, optimal control theory, game theory, actuarial science, etc etc etc for maybe about 4 years and those 4 years were within what we can still call reasonably recent memory...but it was entirely as a subject-focused autodidact so there are obviously some really big holes. Whatever...
- I have run out a whole bunch of retirement finance dreck here on this blog -- a lot of it -- which depends, of course, quite a bit, on the previous bullet point. But then again I have taken all of this as far as I really want to take it...see below...
Do I know what I'm doing? No idea. Maybe. Probably. Pretty sure. Yes. So there! My sandbagging is out of the way. If you want more cred than that, read ERN or SSRN.
Also, I have to say that I am, as I hinted in the last bullet above, pretty much done with this whole blog thing. Why am I "done?"
- I answered most, if not all, of the questions I wanted answers to, and they were all for my own reasons. I have blogged on the "why I started this thing" before. I can do it again if anyone is interested. Actually, it's a pretty good story,
- I got both bored and/or tired of the subject. It is hard, complex and in the end there are really no perfect answers. That last point has been weighing on my for a couple years. I mean, why bother?
- I can't monetize my 3 readers. Heh ;-) Paypal me if you must! David, send money,
- I am trying to focus on other goals like moving north again, art and literature, and philosophy. I am doing what I call south-to-north, left-brain to right, middle aged to late-middle-aged. Act II to Act III of IV. blah blah blah...
- I have way more confidence in seat-of-the-pants or generalized answers or methods. I kinda know stuff now, the stuff that old folks have intuited for centuries[3]. I can see the flow of things (my original goal) better. I used to poll old folks (my age now, ha!) and they always laughed at me: "why so much math? it's really simple. Why do you over-complicate?" It really is simple if you don't work for a university or a brokerage.
- I busted through enough amateur boundaries for one decade. I've done what, in my humble estimation (maybe cocky, idk), few amateurs have done. Most of the others in this zone are academics, advanced pros, and PhDs in econ. Idk, how much farther can I go as me? The incentives are a little whack, if you know what I mean.
So, now what? Another post? Sure, why not.
I was just at my girlfriend's (strange to call a 66yo grandmother a "gf" but whatever) house and she was like "what are you thinking about?" as I was staring into my coffee a couple mornings ago. Me: "Uh, idk, maybe how lucky you are??" ...cold stare... "no, actually, really, I was thinking about what if I did a Perfect Withdrawal Rate but then added both random lifetime [a past innovation by me btw] AND a fat tailed return distribution [again, new by me]." She, of course, being both a kind person and a classical pianist (with a broken hand, fwiw) looked at me like I had two, no three, no four, heads. I mean, who thinks up these ret-fin things. I guess me, Moshe and David. Maybe a couple others.
Now that I think of it, I once coaxed a famous professor of ret-fin to admit that even his wife shakes her head at this stuff. Now that was funny. Those bylines in research papers are real people, fwiw. I never knew that. I thought they were all robots printing stuff from the cached memory of their AI. Teasing. Most of the men and women to whom I have reached out have been very very generous with both their time and thoughts. And they all really do think about this stuff. Crazy, right?
But then again, all of these types of questions have taken me through almost a decade of blogging. Do I really need to know the answer to all of my weird questions? No, not really, but once posed, I kinda want to see what they look like. This has been the impetus for almost a decade, so here we are...
So, the post: What happens of we inflect a PWR distribution with both stochastic longevity AND fat tailed returns...in at least one scenario. Let's dig in...
The Fat Returns
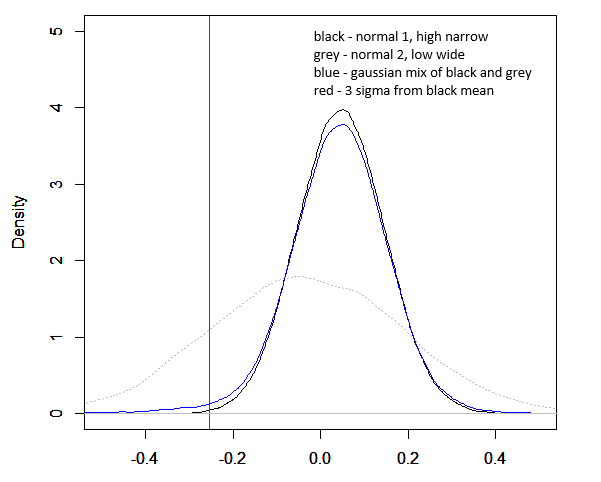
I originally tried to use some chaos theory here on this blog, a little Gutenberg Richter math. But it didn't work as well with "returns" as it did in the past with "net worth." So, this time, with this particular problem, I used a gaussian mix, once again. It works pretty well to punch out a left tail. My only problem is that in creating the mix, the two distributions imply there are two normal statistical processes, both predictable and orderly and both then combined to create a "mix." Obviously that is not what happens irl with "processes." Rather we probably have a typical random expected return process (black in fig 1) but then with some other chaotic thing whacking it on occasion, so maybe: 1929, 1987, 2008, etc (blue in the long run). So, I'm not a fan of Gaussian mix on general principle, although in simulation-practice it works pretty well for my purposes. The purpose here is to nudge out the left tail of "black." I was shooting for a combined distribution of about 4% real and a 12% sd. [1] To do that I did this where "blue" is the mix and "black" and "grey" are the underlying distributions weighted 92% to black and 8% to grey. [4]

which looks like this when simulated a bunch of times (100,000):
 |
| Figure 1 |
Looking at the left tail, relative to a 3 sigma down move in the normal distribution in this sim (black, -25.4%), it looks like, if I understand this correctly, that it'd be 742 years between a 3 sigma event in normal (yearly returns, not daily) and 72 years in a fat tail, or 10x more likely??? DM if I have this wrong. See paragraph 1 above. Not solid on this yet


Translated into PWR -- Perfect withdrawal Rate -- math
Ok so now lets use this data above to run a perfect withdrawal rate sim. I'll not belabor the PWR math. Go to SSRN and look up Suarez & Suarez or Andrew Clare. ERN has a version in his technical appendix 17. Or look up PWR/"perfect withdrawal rate" on my blog. Without additional comment, it is this (while noting that this is a stripped down version of the original...

 |
| Figure 2 |
Blue - is the PWR distribution based on the black return line in figure 1. If I'd been smart I would have used or synchronized the same color but.... This blue here is the normal distribution (black in fig 1) but rendered here in withdrawal rate terms (blue, fig 2) ie when that normal distribution (black in fig 1) is simulated in a PWR sim.
Black - is the PWR distribution we did in blue (fig 2) but now with random lifetime as described above. In a past post, I made the now obvious point once that when going from a fixed 30 y horizon to random lifetime, one will run into scenarios where life is 1 year (so, way higher spend is possible) and then scenarios where life is really long (so 30 or more, like the fixed horizon...so the lower spend rates don't change all that much on the left side of figure 2). That means the shift from blue to black in fig 2 makes a ton of sense.
Red - Red is the black line described just above but now simulated with the fat tailed distribution described earlier. Obviously if one dies in one year the distribution matters little. If one lives forever (or, say, 120) then clearly one has to be a little more circumspect in spending in the presence of weird left tail events. Also, as clearly, the full universe of left tail possibilities is not explored here through different parameters. Again, this is just one illustration.
Grey Vertical - This is the 5th percentile of Red, just for reference.
The spend rates for the 5th and 10th percentiles are as follows where W1 is blue, W2 is black and W3 is red. The delta is, eg, W2/W1-1 and so forth. [2]

Conclusion??????
What can we say. As a dead end blogger: idk. Mostly what I see is this:
a) random lifetime means one can maybe spend more ??? because one might possibly keel over before 30 years -- oh, btw, we were using a 60yo start age fwiw, I forgot -- but not a super high new spend: 13-14% or in this post (ONLY under this parameterization. again if you want to paypal me, I'll do other scenarios).
And then,
b) adding in fat tails, the spend rates get more conservative but only for the lower tranches of spend.
But I could have predicted all that before we even started. And the conservatism (ONLY under this parameterization) in this move seems kinda small anyway.
[1] people have asked me "why that param?" Idk, just seems illustrative. Also, I mean really, think about projecting forward-inflation correctly in say 2019 or forward returns over some horizon starting in 2006, 7, 8, 9, 10, etc. It is impossible, so we just go with something. I could do multiple parameterizations but read the 2nd paragraph. I'm more or less done with blogging; I don't have the stamina. If someone wants to pay me to run more stuff great! but we'll stick with one illustration for now.
[2] In a past post I can't find, which means I was too lazy to look for it, I made a pretty compelling case that the percentiles on spend rates were, and likely are, very connected to fail rates or success rates, depending on the way we describe it.
[3] idk. I think retirement finance depends on a very predictable world. 2020-2022 has totally f'd things up imo. My guess is that the world is possibly on the cusp of a major inflection point, covid notwithstanding, that could jumble up aaaaall assumptions. I hope I am wrong. I try to imagine me sometimes in the post-apocalypse, bartering my ret-fin knowledge for food or cigarettes or sex (heh) and coming up a bit short. Ammunition and martial skills might sell better but at 63 idk.
[4] Why this fat tail? This really has no link to reality. Mostly I am just trying to add one increment of left tail fatness. The reality is for others to decide. I mean, there are 10,000 other parameters. Where to begin and end is for others.
------------------ References ---------------------------------
Suarez Suarez & Waltz | * | The Perfect Withdrawal Amount, A Methodology… | 2015 | Trinity University |
Clare, Andrew et al | * | Can sustainable withdrawal rates be enhanced by trend following? | 2017 | Cass Business school |
Clare, Andrew et al | * | Reducing Sequence Risk Using Trend Following and the CAPE ratio | 2017 | CFA Institute |
Search PWR or "Perfect Withdrawal Rate" on this blog. Or Suarez. Or Clare. I did a bunch of posts.
FWIW, you might enjoy the book I am currently making my way through, see: https://www.amazon.co.uk/Art-More-mathematics-created-civilisation/dp/1912854953
ReplyDelete